It is the most famous graph in the history of medicine, and almost everything the public knows about it is a little wrong. The name is wrong, for Florence Nightingale never called it a coxcomb. The first version was wrong, and she drew it, caught her own error, and drew it again. The notion that she invented the statistical diagram is wrong as well. What she actually did was rarer than any of these and harder: she took a true number that no one in power would read, and made it into a picture they could not look away from.
The passionate statistician
The woman who came back from Scutari to break her health over the army's death tables was, by temperament and conviction, a statistician. Her Unitarian faith and her reading of the Belgian Adolphe Quetelet had taught her to see in mass numbers the regularities by which the world was actually run, and which she took to be the laws of God; to study statistics, in the conviction her admirer Karl Pearson would later distil, was to read the measure of His purpose.1 With William Farr, the General Register Office statistician whose mortality returns John Snow had used on the cholera, she turned the army's own figures into an indictment.2
The figures said what the legend of the lamp had hidden: that disease, not the enemy, had destroyed the army in the East, and that the cleaning of the hospitals had turned the dying around. The trouble was never the truth of it. The trouble was that no one would read it. Government reports buried their evidence in appendices that none but scientific men ever opened, in tables set in double columns that turned the eye away. Nightingale grasped, earlier and more fiercely than almost anyone, that a fact which cannot get itself read saves no one, and that the road to a minister's conviction ran not through his reason but through his eye. The diagram, she wrote, was to affect through the eyes what we fail to convey to the public through their word-proof ears.3
The diagram
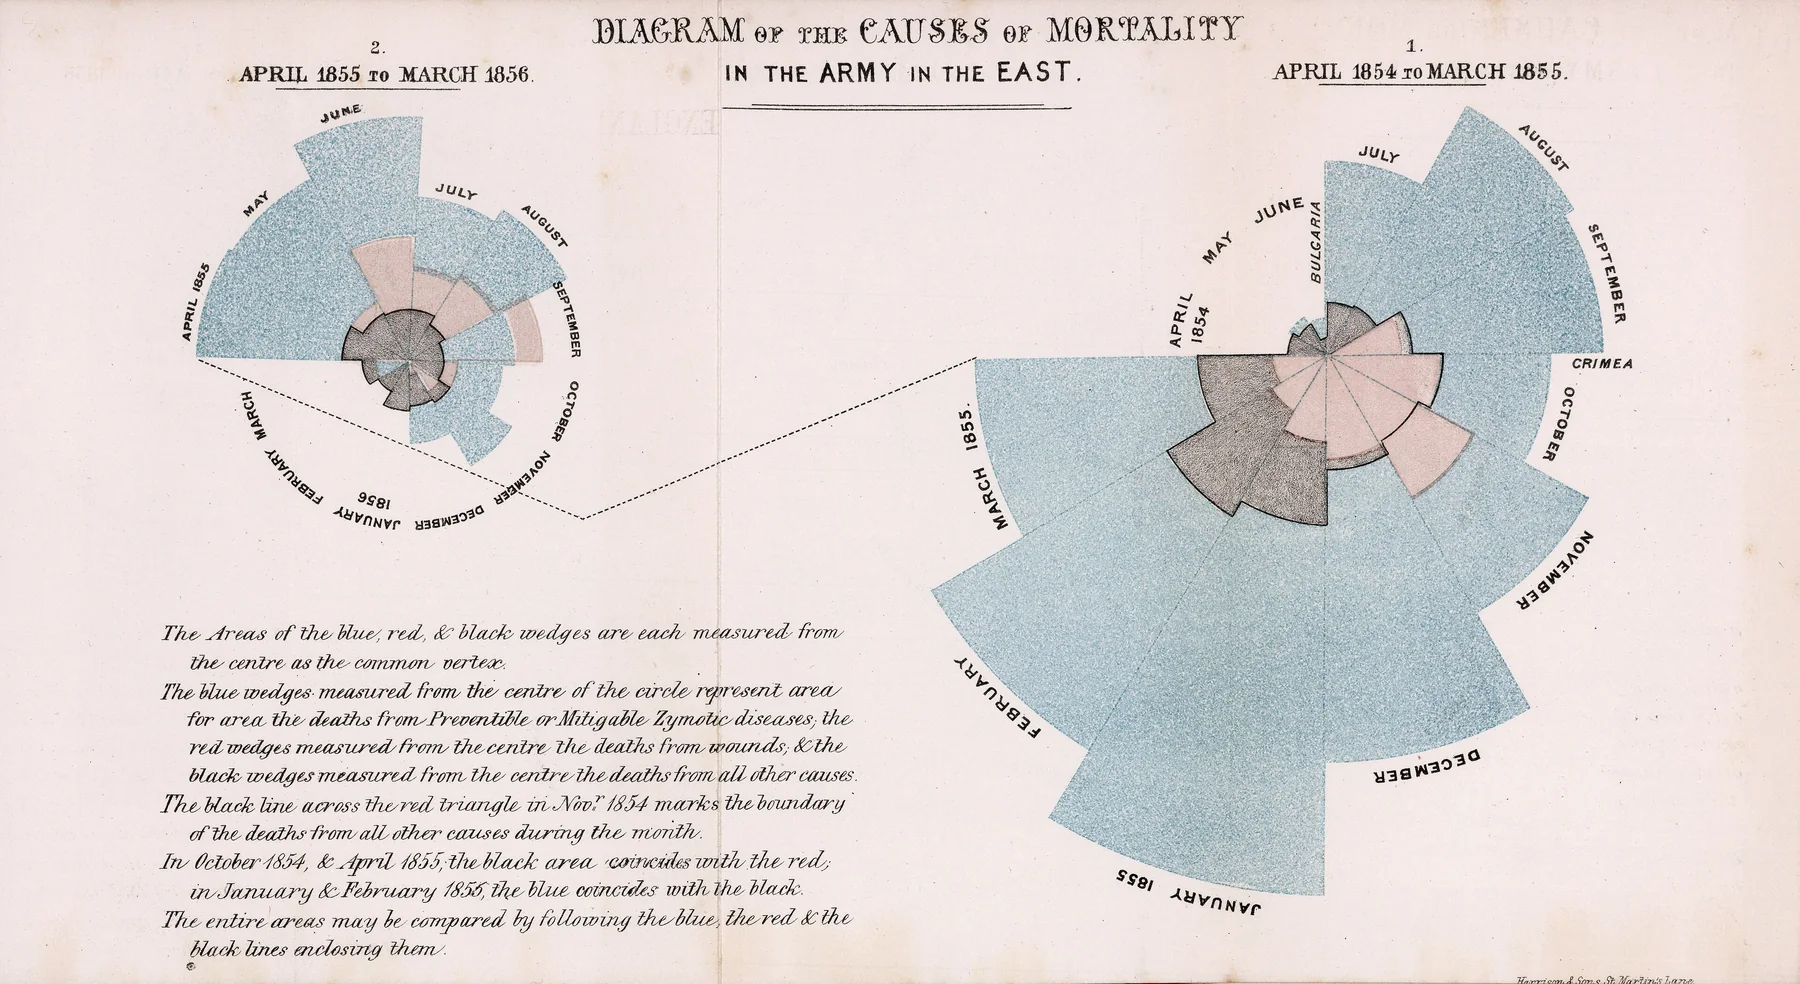
So she built a picture. Two circles sit side by side, the right one the first year of the war, the left one the second. Each is cut into twelve wedges, one for each month, and each wedge is shaded in three colours: blue for the men killed by preventable disease, red for those killed by wounds, black for all other causes. The blue floods the figure and the red is a thin core at the centre, and the meaning leaps out before a single number is read. Most of the army died of sickness, not of the Russians. And the left-hand circle, the second year, is suddenly small, the great blue petals collapsed inward, because by then the Sanitary Commission had gone out and cleaned the drains.4
She published it in 1858 and 1859, in the appendix to her Royal Commission and in private editions she had printed at her own expense and sent where they would do their work, into the hands of ministers and generals and, at last, the Queen. There was nothing subtle in the intention. A man who would never finish a table of mortality could not escape a diagram in which the blue was manifestly vast and the red was small, and in which the killing field of the first winter shrank to almost nothing once the sewers were flushed. The eye did in a moment what the columns of figures had failed to do in three years.
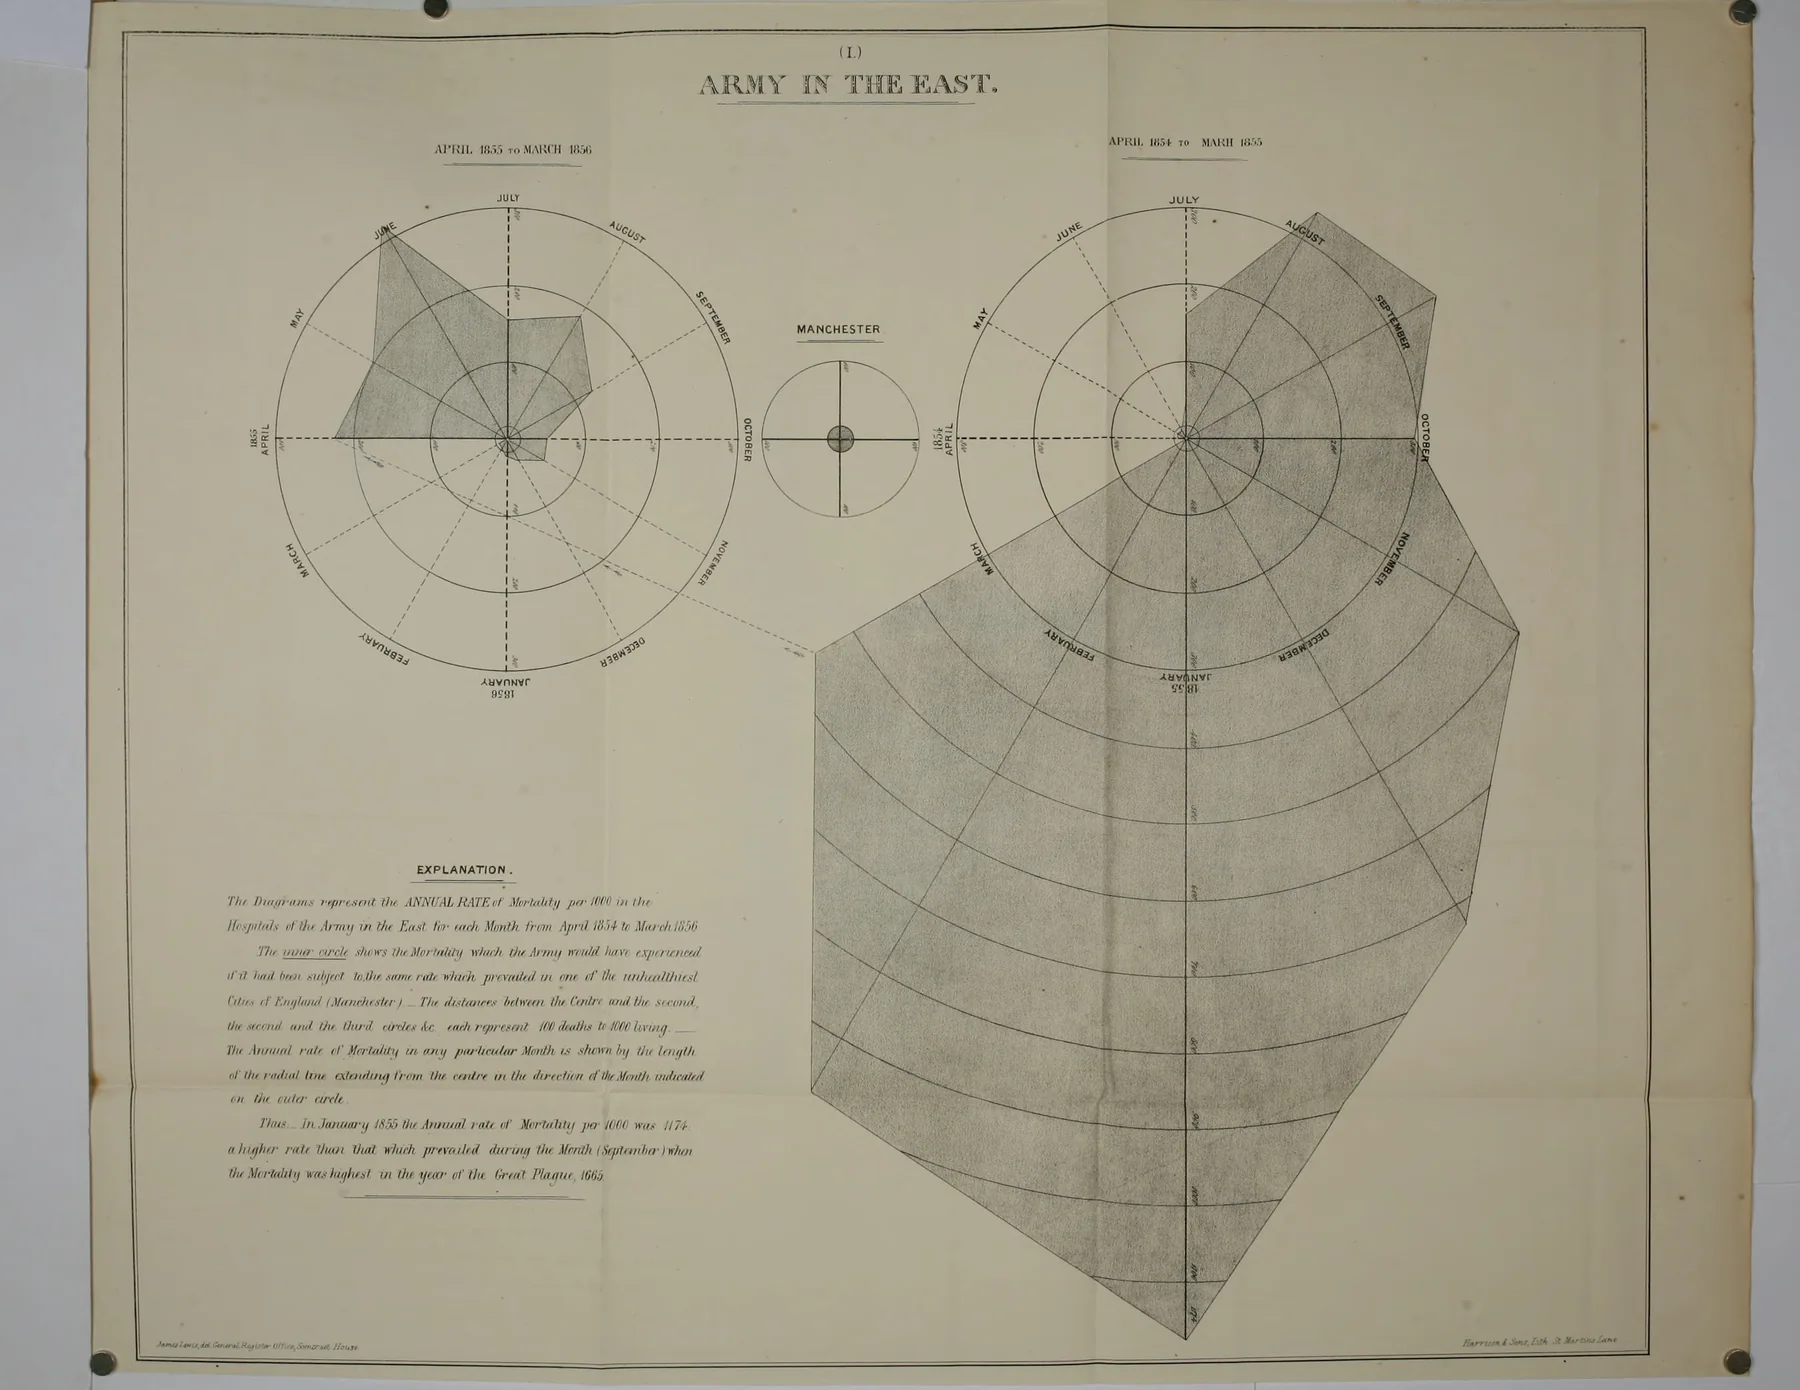
The error she caught
Here the story turns, and turns in her favour. The first version of the diagram, which Nightingale called the bat's wing, was misleading, and misleading in exactly the organ she meant to convince. In it the length of each month's wedge, its radius, was drawn in proportion to the death rate. But the eye does not read a wedge by its radius; it reads it by its area, and area grows as the square of the radius, so the worst months swelled far beyond their true weight and the picture shouted louder than the facts.5 The instrument of persuasion was, at first, an instrument of distortion.
What she did then is the reason the diagram deserves its fame, though not for the reason usually given. She caught the error herself, slipped a correction into the printed copies, and redrew the whole thing so that the area of each wedge, not its radius, carried the number. Area for area, the new wedges told the true size of the dying and no more.6 It is a small act of geometry and a large act of conscience: the propagandist makes the chart frighten; the scientist makes it frighten only as much as the truth warrants. The corrected diagram is the one the world has copied ever since, almost always under the wrong name, for the word coxcomb that clings to it was Nightingale's name not for the picture but for the cheap, gaudy booklet of her report, the showy part she hoped a minister might actually open. The misnaming began with her biographer half a century later and has never let go.7
What she did not invent
She did not invent the statistical graph, and she would not have claimed to. William Playfair had drawn the first bar charts and the first pie chart half a century earlier; Farr himself had been setting mortality into shaded diagrams in his official reports, and Nightingale learned the craft partly from him.8 What was new in her hands was not the picture but its purpose. Playfair's charts compared one country with another, and Farr's described what had happened. Nightingale's demanded that something be done. Hers used fresh data to argue cause and effect, what she called a law: that filth killed, and that cleaning it would stop the killing, and that therefore the army must be made to clean. She was perhaps the first person to use a diagram not to inform but to force a change, and the establishment understood the threat well enough that the Statistical Society, in 1858, made her its first woman Fellow.9
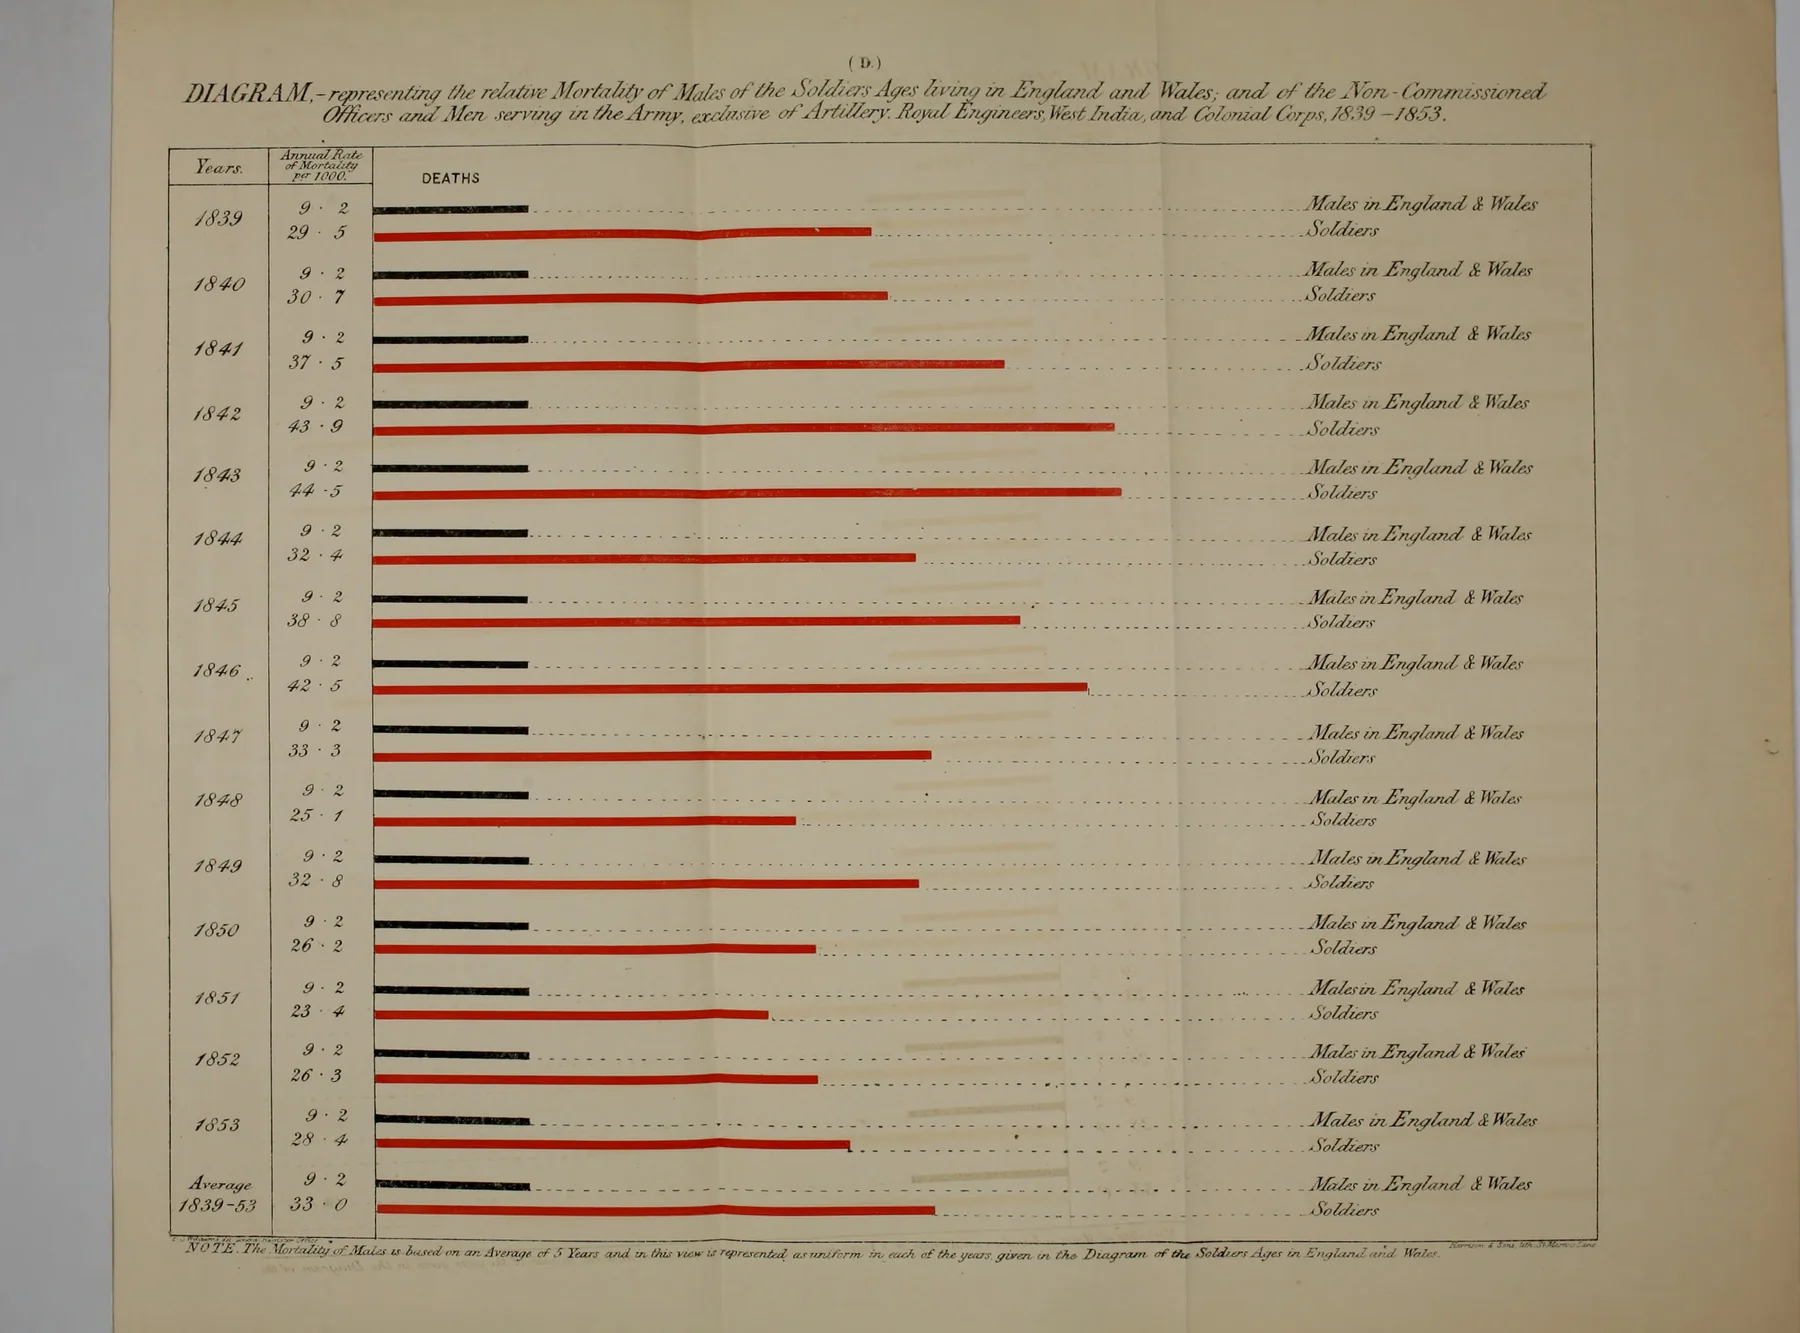
The reform was real, and it outran the war that prompted it. Her plainest chart, a row of bars she titled the Lines, showed that soldiers in their barracks in peacetime England were dying at about twice the rate of the civilians in the towns around them, a scandal still in progress rather than safely in the past.10 The sanitary measures she drove through cut that toll, and the same arguments reshaped the building of civilian hospitals and the government of public health. The form outlived its occasion too. Every shaded map of an epidemic and every dashboard of a disease, every picture that has moved a government to act on a graph it would not act on as a column of figures, belongs to the lineage of a woman who set out to make power feel the size of a number it refused to read.
Read from the Ward
The last time a single picture changed how I practise, it was two survival curves on a screen in a darkened hall, peeling apart early and never touching again. I had read the paper and the numbers had been there in the table, and I had not truly believed them until I saw the gap. That is the disreputable secret of evidence-based medicine, the part we are slow to say aloud: a chart can move a clinician where a sentence cannot, and I am persuaded through the eye like everyone else. Nightingale knew this about us a century and a half ago, and she felt no shame in it. She built her case for the eye on purpose.
What I admire is the order in which she did it. She had the true number first, dug out of the army's own returns with Farr, and only then went hunting for the image that would carry it past the ministers' word-proof ears. The picture was the last step of the argument and not the first, and the argument underneath was sound. When I show a family a falling trend on the monitor, or stand before a committee with a figure meant to change what they do, I am performing a smaller and more dangerous version of the same act, and I try to keep her order in mind: the truth, and then the picture of it, never the picture in place of it.
Because the picture can lie, and hers did, at first. The bat's wing scaled its wedges by the radius while the eye drank in the area, and so it wept louder than the facts. The detail I cannot get past is what she did next. She caught it, and she redrew it, so that the image told the exact size of the thing and not a fraction more. That is most of the ethics of my trade compressed into a problem of draughtsmanship. It is easy to make a frightening graph, the resistance curve bent to look like a cliff, the mortality line with its axis quietly clipped. The discipline is to draw the true one, area for area, on the days when a more alarming picture would carry the room faster.
We are drowning in charts now in a way she could not have pictured, a dashboard for every ward and a colour-coded map for every outbreak, most of them honest and a few of them not, and the eye alone cannot always tell which is which. Her diagram is well over a century old and remains the cleanest statement of why the question matters: that a number no one will read is a number that saves no one, so the making of it visible is part of the medicine and not an ornament upon it. She made the dead of a half-forgotten war impossible to look away from, and she made the picture true. I have not often managed both at once. It is the right thing to be trying for.
- On Nightingale's Unitarian faith, her debt to Adolphe Quetelet, and her view of statistics as the reading of divine law, see Marion Diamond and Mervyn Stone, "Nightingale on Quetelet," Journal of the Royal Statistical Society, Series A 144 (1981): 66-79, 176-213, 332-51; Lynn McDonald, ed., The Collected Works of Florence Nightingale (Waterloo, ON: Wilfrid Laurier University Press, 2001- ). The often-quoted line that to study statistics is to read "the measure of His purpose" is Karl Pearson's paraphrase of her conviction (The Life, Letters and Labours of Francis Galton, vol. 2, 1924), not a verbatim quotation of Nightingale.↩
- On the collaboration with William Farr — the General Register Office statistician whose mortality returns John Snow had drawn on in the cholera work — and the compilation of the army's Crimean mortality data, see Hugh Small, Florence Nightingale: Avenging Angel (London: Constable, 1998); Nightingale, Notes on Matters Affecting the Health, Efficiency, and Hospital Administration of the British Army (London: Harrison and Sons, 1858).↩
- "The diagram which is to affect thro' the Eyes what we may fail to convey to the public through their word-proof ears": Nightingale, quoted in Hugh Small, "Florence Nightingale's Statistical Diagrams" (Florence Nightingale Museum, 1998); Edward T. Cook, The Life of Florence Nightingale (London: Macmillan, 1913).↩
- On the diagram's construction (two annual circles, twelve monthly wedges, blue for preventable zymotic disease, red for wounds, black for other causes), its publication in Appendix 72 of the Royal Commission report (1858), the private Mortality of the British Army (1858), and A Contribution to the Sanitary History of the British Army (1859), see Small, "Statistical Diagrams"; Nightingale, Notes on Matters (1858).↩
- On the "bat's wing," in which the radius rather than the area of each wedge was scaled to the death rate — so that area, which the eye actually reads, exaggerated the worst months — see Hugh Small, "Florence Nightingale's Statistical Diagrams" (1998).↩
- Nightingale recognised the distortion, inserted an erratum, and replaced the bat's wing with the corrected "wedges" diagram (in documents of 1859), in which area is proportional to mortality, "area for area": Small, "Statistical Diagrams."↩
- That "coxcomb" was Nightingale's term for the cheap, colourful booklet (Mortality of the British Army, some 2,000 copies) and not for the diagram, and that the misapplication to the late-1858 "wedges" diagram dates from Sir Edward Cook, The Life of Florence Nightingale (London: Macmillan, 1913), 1:386, is established in Hugh Small, "Florence Nightingale's Statistical Diagrams" (1998), citing Nightingale's letter to Sidney Herbert, 25 December 1857 (BL Add. MSS 43394).↩
- On William Playfair as the founder of statistical graphics (the line and bar charts of 1786, the first pie chart in the Statistical Breviary, 1801) and on Farr's prior use of area diagrams, see Small, "Statistical Diagrams"; William Playfair, The Statistical Breviary (London, 1801).↩
- Nightingale was elected the first woman Fellow of the Statistical Society of London (later the Royal Statistical Society) in 1858, and an honorary member of the American Statistical Association in 1874. On the prescriptive, cause-and-effect purpose of her graphics ("perhaps the first to use them for persuading people of the need for change"), see Small, "Statistical Diagrams."↩
- On the "Lines" diagram, showing that soldiers in English barracks in peacetime died at roughly twice the rate of the surrounding civilian population, see Small, "Florence Nightingale's Statistical Diagrams" (1998).↩
- Cook, Edward T. The Life of Florence Nightingale. 2 vols. London: Macmillan, 1913.
- Diamond, Marion, and Mervyn Stone. "Nightingale on Quetelet." Journal of the Royal Statistical Society, Series A 144 (1981): 66-79, 176-213, 332-51.
- Nightingale, Florence. Notes on Matters Affecting the Health, Efficiency, and Hospital Administration of the British Army. London: Harrison and Sons, 1858.
- Playfair, William. The Statistical Breviary. London: T. Bensley, 1801.
- Small, Hugh. Florence Nightingale: Avenging Angel. London: Constable, 1998.
- Small, Hugh. "Florence Nightingale's Statistical Diagrams." Paper given at the Stats & Lamps conference, Florence Nightingale Museum, 18 March 1998.